In today's global marketplace, understanding where your sales are coming from is essential for strategic decision-making and business growth. By analyzing total sales data by country, companies can identify key markets, pinpoint areas for expansion, and tailor their marketing and sales strategies to maximize revenue potential. In this article, we'll explore the power of visualizing total sales by country using a top 10 treemap chart, and how it can provide valuable insights into your sales performance around the world.
What is a Treemap Chart?
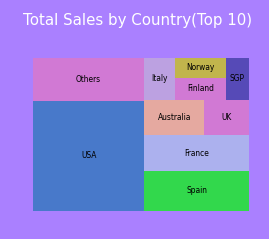
A treemap chart is a visual representation of hierarchical data using nested rectangles. Each rectangle represents a category or sub-category, and its size corresponds to a quantitative value, such as sales revenue. Treemap charts are particularly useful for displaying large amounts of data in a compact and easily understandable format, allowing users to quickly identify patterns, trends, and outliers.
Why Total Sales by Country?
Analyzing total sales by country provides businesses with valuable insights into their global sales performance. It allows companies to identify their top-performing markets, assess the impact of regional factors on sales, and uncover opportunities for growth and expansion. By visualizing total sales data in a treemap chart, businesses can gain a clear understanding of the distribution of sales across different countries and prioritize their efforts accordingly.
Exploring the Top 10 Treemap Chart
Imagine you're a global e-commerce retailer looking to analyze your total sales by country over the past year. You've collected sales data from all your international markets and want to identify the top 10 countries that contribute the most to your overall revenue. Using a top 10 treemap chart, you can easily visualize this information and uncover insights into your sales performance around the world.
In the treemap chart, each rectangle represents a country, and its size corresponds to the total sales revenue generated in that country. The top 10 countries with the highest sales revenue are displayed in the chart, allowing you to quickly identify your primary revenue drivers. You may notice that certain countries stand out as significant contributors to your sales, while others may have smaller rectangles indicating lower sales volumes.
Key Insights and Takeaways
- Identify Top Markets: The treemap chart highlights the top-performing countries in terms of sales revenue, allowing you to focus your resources and efforts on these key markets.
- Regional Trends: By visually comparing the sizes of the rectangles representing different countries, you can identify regional trends and patterns in your sales data. This can help you understand the factors driving sales in each region and tailor your marketing and sales strategies accordingly.
- Opportunities for Growth: The treemap chart may reveal opportunities for growth and expansion in emerging markets or underserved regions. By identifying countries with smaller rectangles but potential for growth, you can develop targeted strategies to capture market share and increase sales revenue.
Conclusion
Total sales by country is a critical metric for businesses operating in the global marketplace. By visualizing this data using a top 10 treemap chart, companies can gain valuable insights into their sales performance around the world, identify key markets, and uncover opportunities for growth and expansion. Whether you're a multinational corporation or a small business with international aspirations, understanding where your sales are coming from is essential for success in today's interconnected world.
So why wait? Dive into your total sales data by country today and unlock insights that can propel your business forward in the global marketplace.


No comments:
Post a Comment